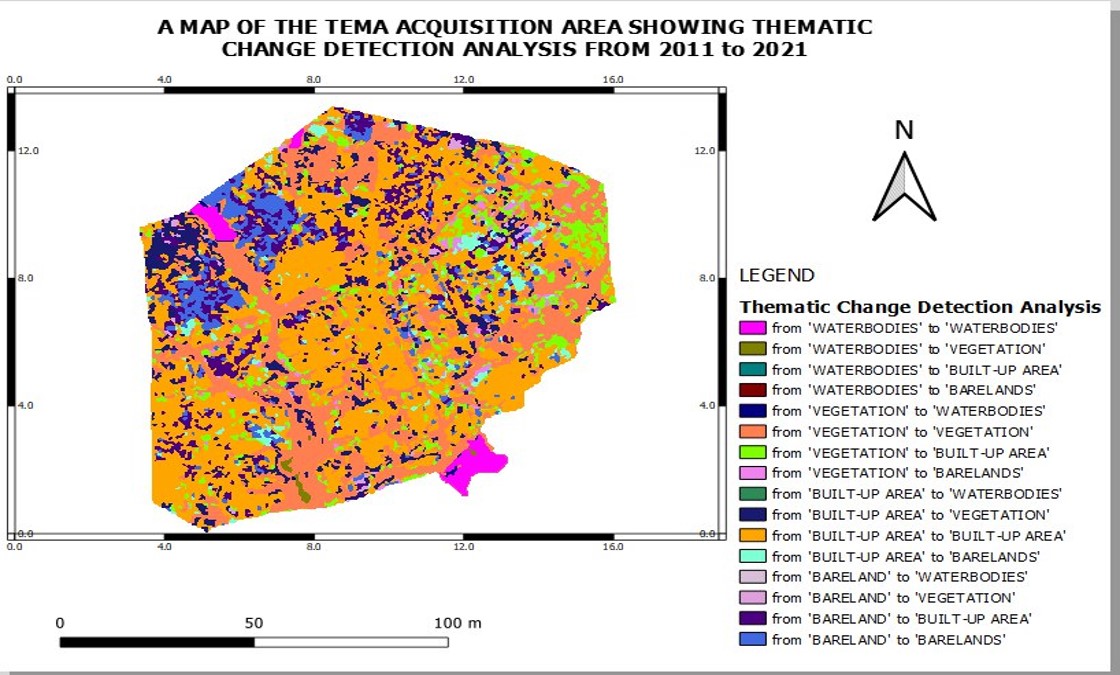
Examining the Effect of Urban Sprawl in the City of Tema
This map depicts the thematic change detection analysis for the Tema acquisition area over a decade (2011–2021). It highlights transitions among key land use and land cover types, including waterbodies, vegetation, built-up areas, and barelands. The legend provides detailed information on specific changes, such as the conversion from vegetation to built-up areas or barelands.
View Project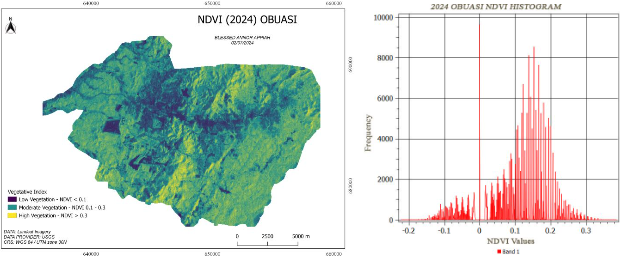
Temporal Analysis of Vegetation Degradation in Obuasi: A Geospatial Perspective
The NDVI map and histogram for 2024 highlight the alarming impact of galamsey (illegal mining) on vegetation in Obuasi. This temporal analysis demonstrates a significant decline in vegetation cover over the years, with the predominance of areas classified as low vegetation (NDVI < 0.1). These degraded zones, driven by galamsey activities, disrupt ecological balance, threaten biodiversity, and expose soils to erosion. This study provides a geospatial overview of vegetation loss, offering critical insights for further analysis. Predictive models can leverage this data to forecast future degradation trends and guide sustainable interventions to mitigate environmental harm and protect our national vegetation and water resources.
View Project
Proposed Buffer Analysis for Motorway Expansion
This map illustrates the buffer analysis for the Accra Mall to Tema Motorway Roundabout expansion project. Created as part of a study, it identifies affected areas within a 600-ft right-of-way, showcasing the potential impact on plots and infrastructure.
View Project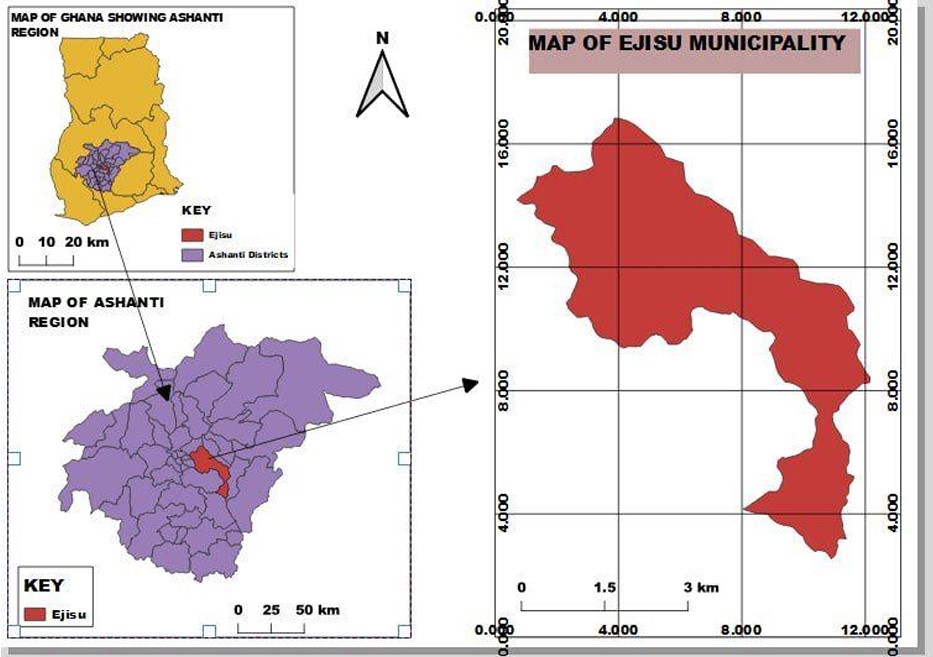
Study Area Map of Ejisu Municipality in the Ashanti Region, Ghana
This map illustrates the location of Ejisu Municipality within the Ashanti Region of Ghana. The inset on the left shows the Ashanti Region's districts, highlighting Ejisu in red. The detailed map on the right displays the municipal boundaries of Ejisu.
View Project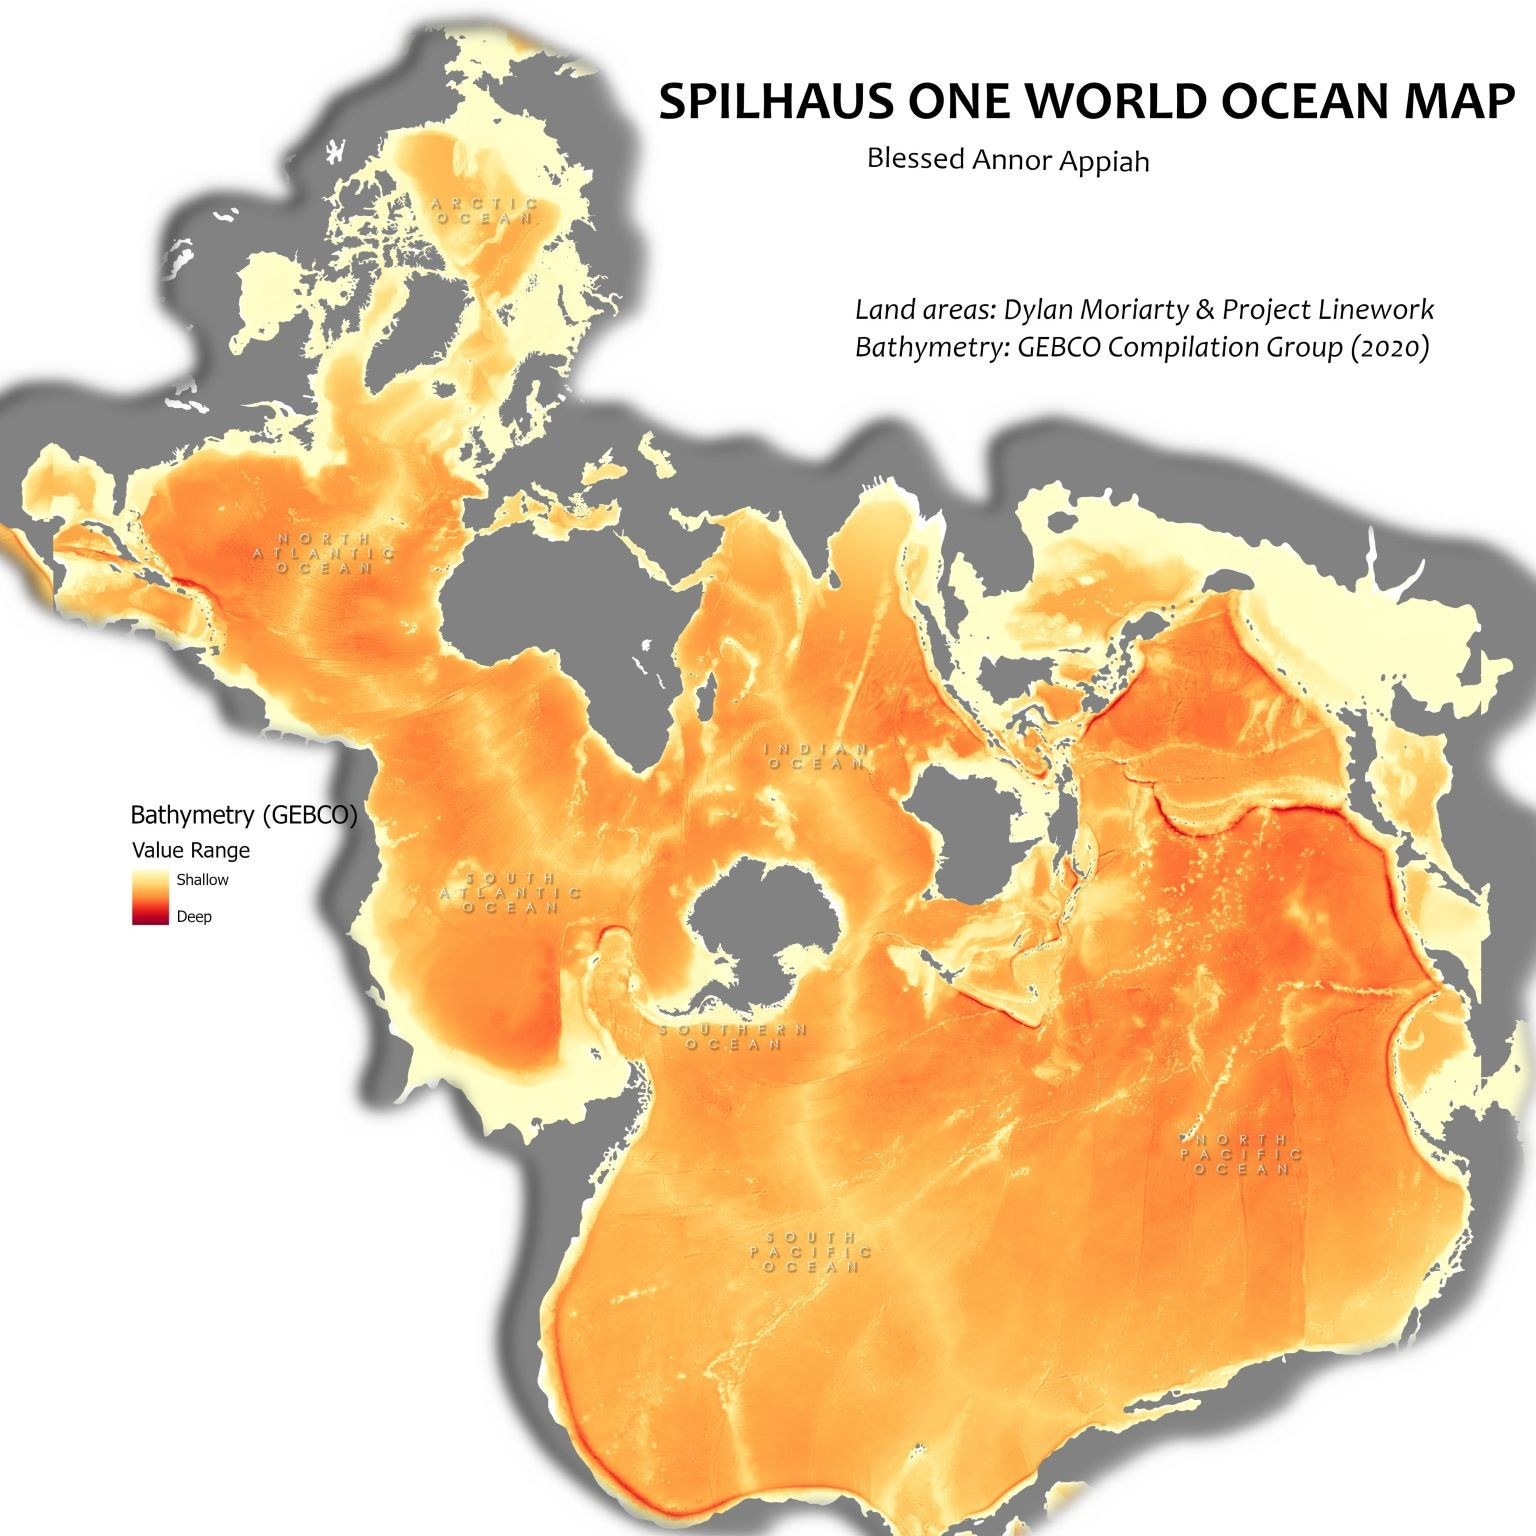
Spilhaus One World Ocean Map
Created as part of a cartography project during an ESRI MOOC, this map illustrates the world's oceans as a single, unified system, with bathymetric details revealing depth variations.
View Project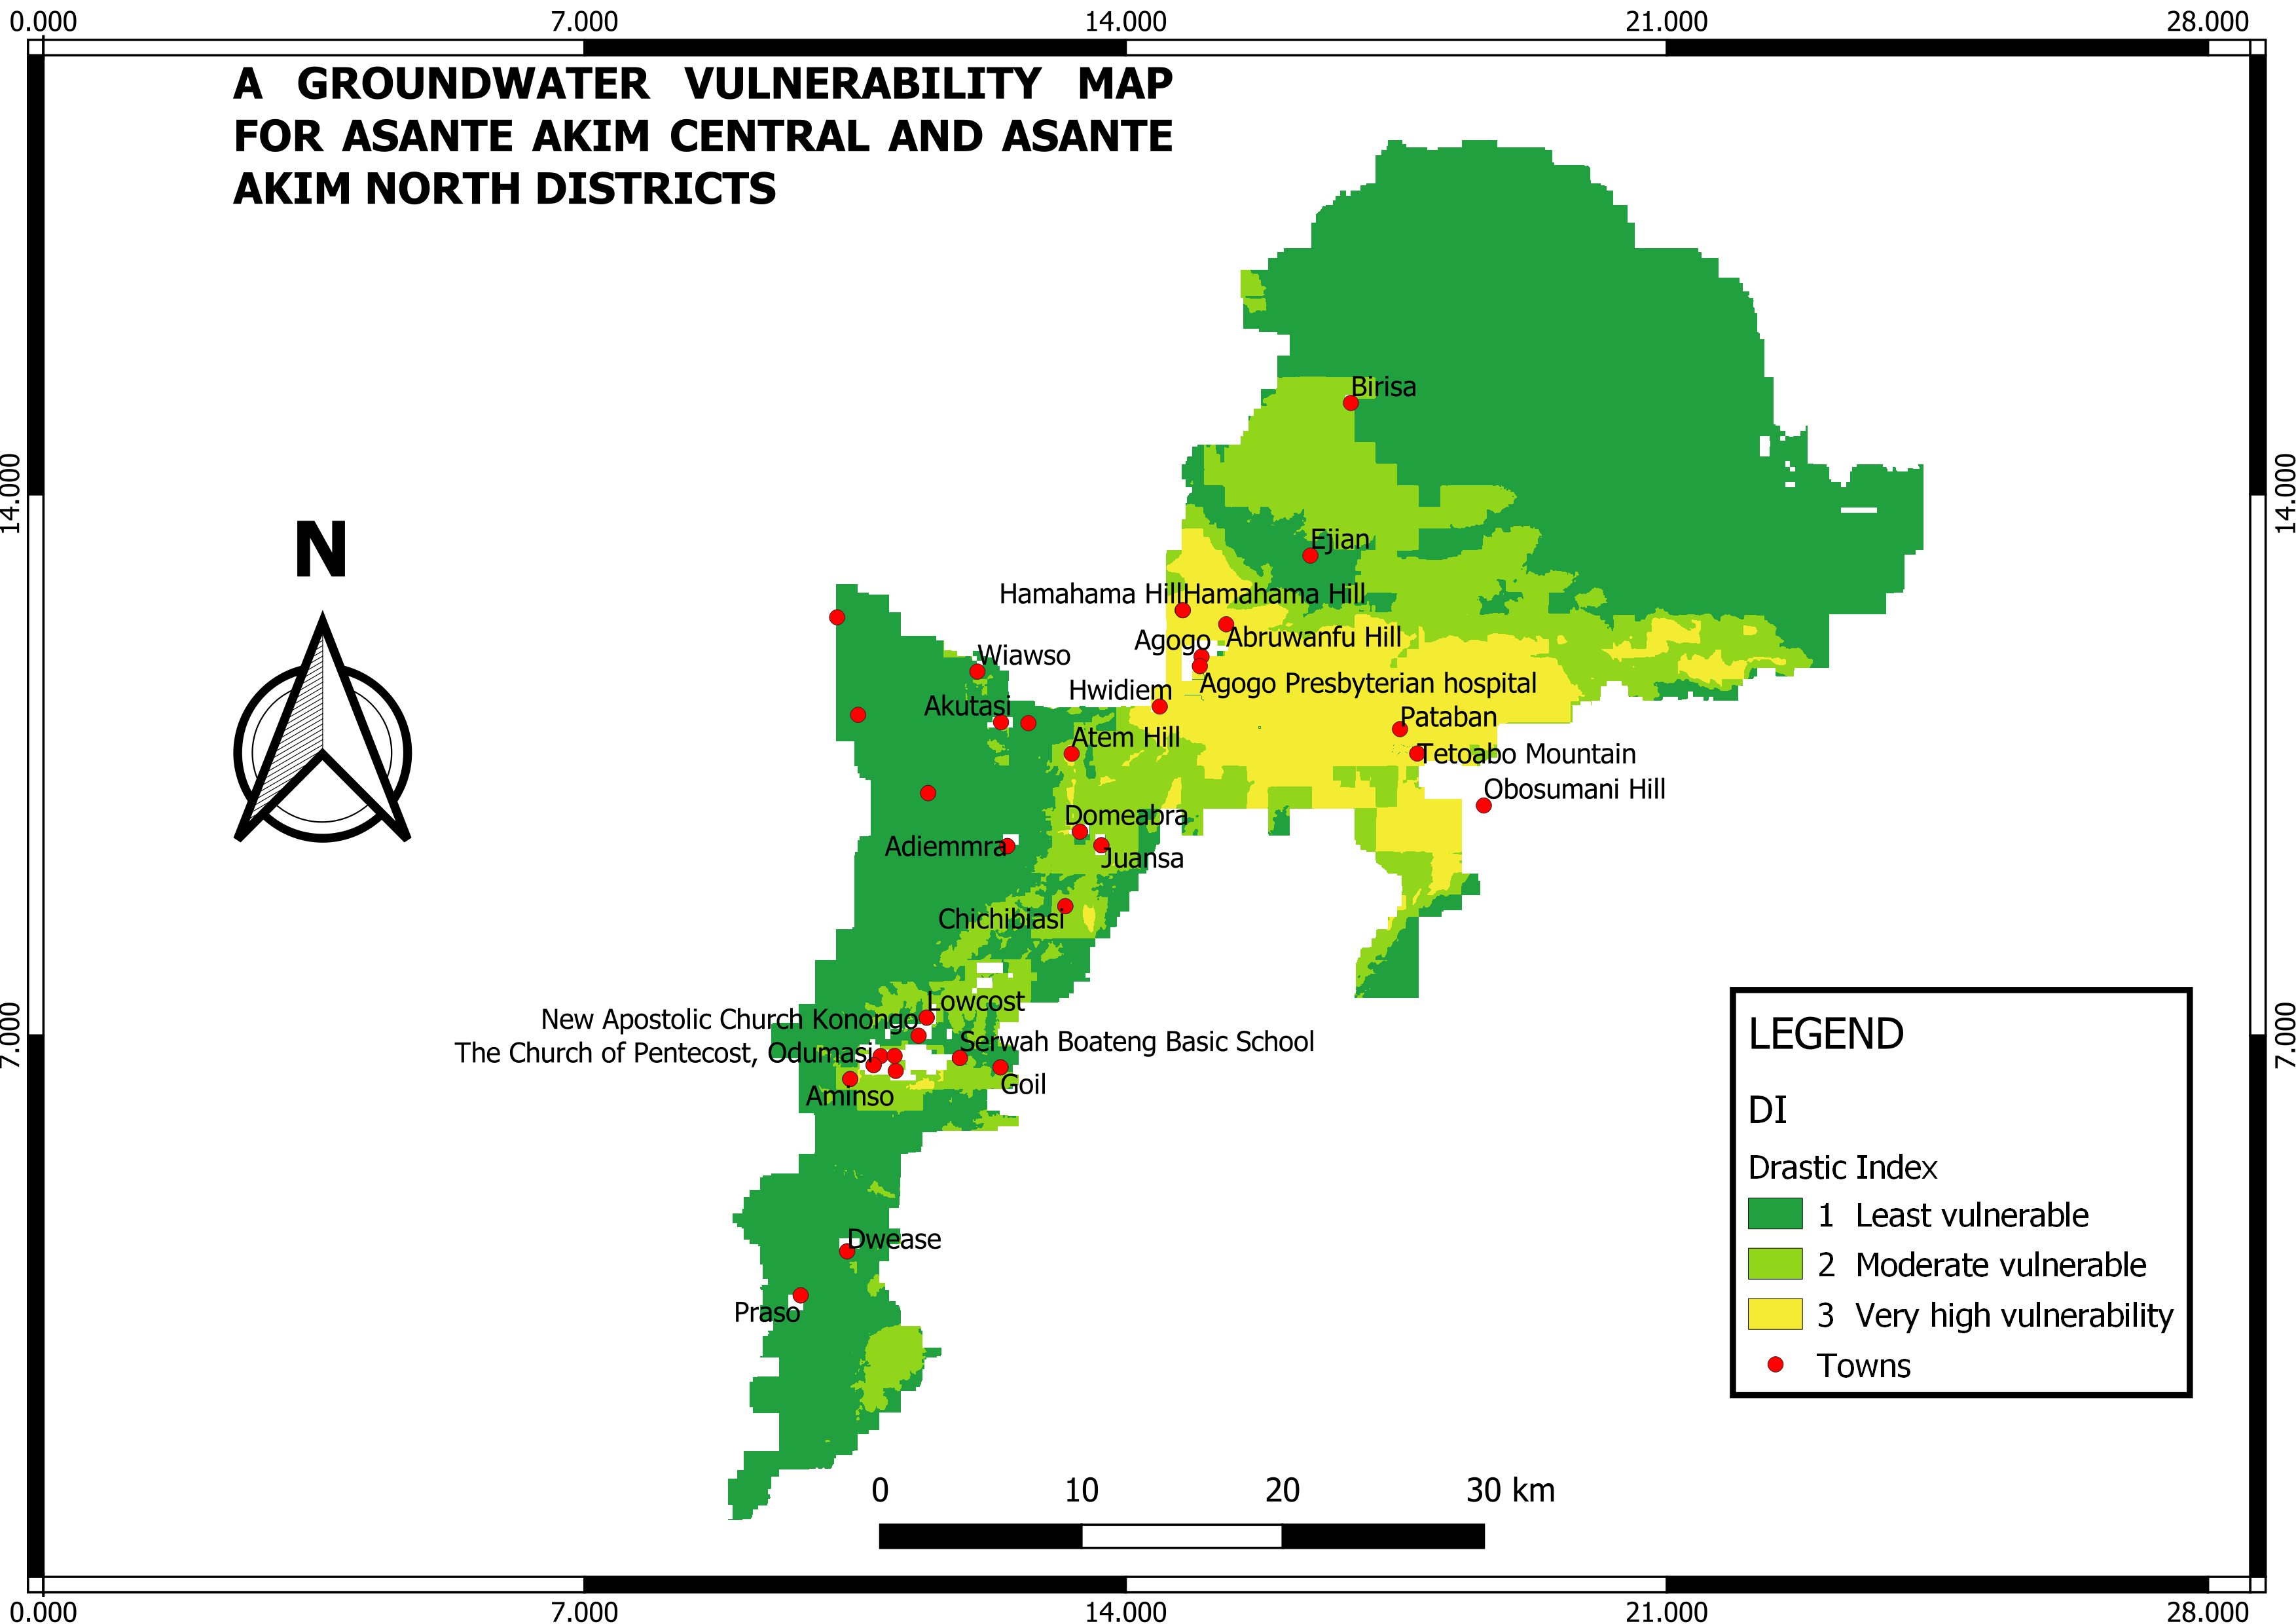
Groundwater vulnerability assessment
This projected focused on the groundwater vulnerability across Asante Akim Central and Asante Akim North Districts, using the Drastic Index (DI) as the primary metric. The vulnerability classification is divided into three categories: Least Vulnerable (Green): Areas with minimal risk to groundwater contamination. Moderate Vulnerability (Light Green): Zones with moderate susceptibility to contamination. Very High Vulnerability (Yellow): Regions with significant exposure to groundwater contamination risks. Red points indicate the locations of towns, aiding in spatial context and planning. This analysis provides valuable insights for sustainable groundwater resource management and can inform decision-making processes for environmental protection and development initiatives
View Project